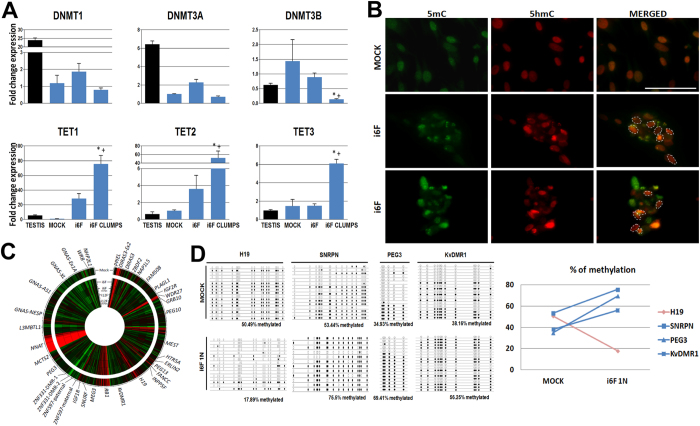
Figure 3. Epigenetic characterization of the in vitro induced fibroblasts.
(A) RT-qPCR expression analysis of the DNA methyl-transferases DNMT1, DNMT3A and DNMT3B, and the TET-mediated de-methylases TET1, TET2 and TET3 over i6F induced fibroblasts 14 days post-transduction (n = 3). Human testis cDNA physiological expression fold change relative to MOCK samples is also shown as a control. Data is presented as normalized fold change mean +/− SEM. (*) represent significant differences (p < 0.05) with controls; (+) represents significant differences (p < 0.05) between i6F whole culture condition and i6F clumps. (B) Representative pictures of the co-localization of 5-methyl-Cytosine (5mC) and 5-hydroxi-methyl-Cytosine (5hmC) over MOCK cells and i6F clumps at 14 days post-transduction. Dashed lines indicate cell nuclei enriched for 5hmC (red) in MOCK control (0/15 nuclei in the picture) and in two illustrative pictures of i6F clumps (7/17 nuclei (41.1%) and 5/18 nuclei (27.7%), respectively) compared with the 5mC signal (green). Scale bar represents a distance of 10 μm. (C) Circular heat map presentation of the methylation for 37 annotated human imprinted loci in induced fibroblasts 14 days post-transduction (n = 3). (D) Bisulphite sequencing results at 14 days post-transduction at the DMR of the H19, SNRPN, PEG3 and KvDMR1 loci in putative 1N sorted i6F cells (n = 3). Diagrams represent methylation status of each CpG dinucleotide on individual DNA clones. Lines represent different clones and columns are different CpG dinucleotides. Methylated CpGs are represented as filled circles and unmethylated CpGs are represented as open circles. Empty CpG sites represent the CpGs that could not be determined. In the graph, blue line indicates the methylation change in the analyzed maternally imprinted loci, whereas pink line indicates the methylation change observed for the paternally imprinted loci H19.

