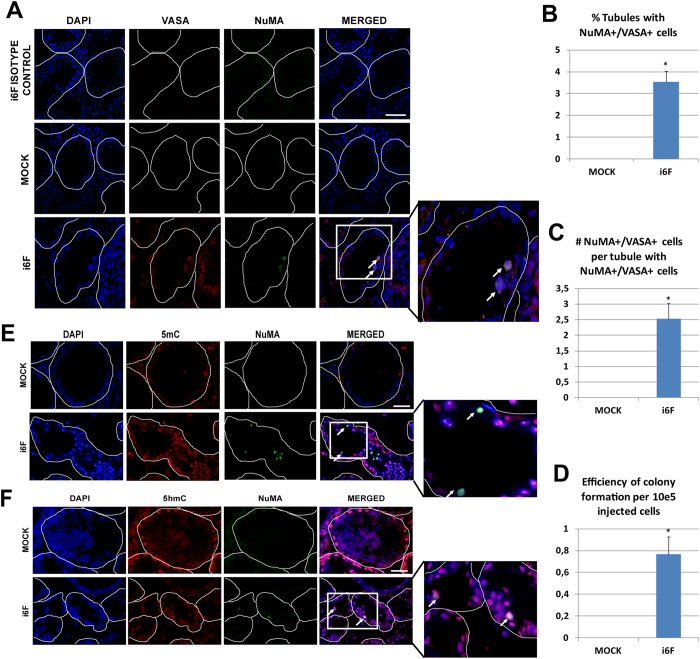
Figure 4. Germ cell xenotransplant results.
(A) Illustrative pictures showing NuMA+/VASA+co-localization on the basal layer of germ cell depleted seminiferous tubules in MOCK and i6F transplanted testis. (B) Percentage of tubules containing NuMA+/VASA+ cells. (C) Average number of NuMA+/VASA+ cells per tubule showing colonizing cells. (D) Efficiency of colonization per 10e5 injected cells in i6F transplanted testis (n = 5 testes). (E) Illustrative pictures showing NuMA/5mC co-localization and (F) NuMA/5hmC co-localization in transplanted testis. Data is presented as mean +/− SEM. Periphery of tubule cross-sections are highlighted by dashed lines. White arrows indicate colonizing human cells. Scale bar represents a distance of 50 μm.

