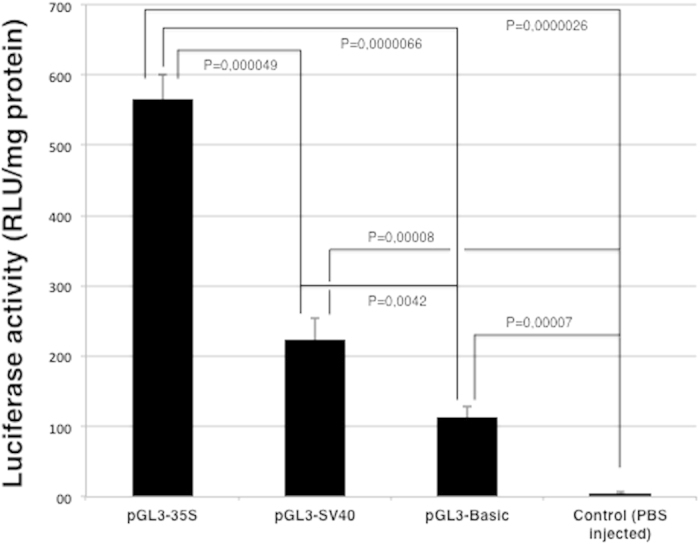
Figure 1. Luminescence quantification of luciferase activity in Atlantic salmon muscle tissue 7 days after intramuscular injection of pDNA (pGL3-35S, pGL3-SV40, pGL3-Basic (promoterless)) or PBS (control).

Each bar represents the mean luciferase activity of five fish per treatment group, and error bars represent S.D. The measured luciferase activity was normalised for total protein content in muscle. P-values are inserted.
