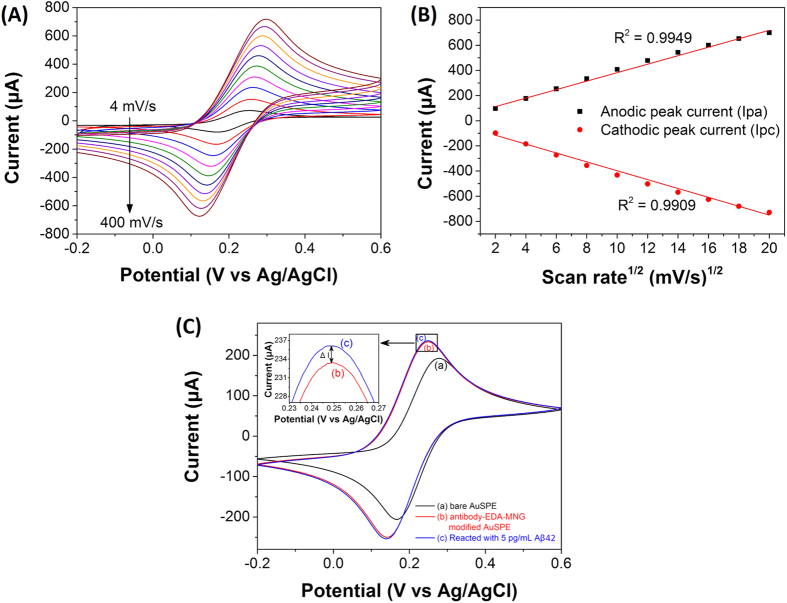
Figure 7.
(A) Cyclic voltammograms of Aβab-MNG modified AuSPE in 0.1 M KCl with 5 mM Fe(CN)63−/Fe(CN)64− at different scan rates (from black to brown): 4, 16, 36, 64, 100, 144, 196, 256, 324, and 400 mV s−1. (B) The plot of anodic (Ipa) and cathodic (Ipc) peak current versus square root of the scan rate (v1/2). (C) Cyclic voltammograms bare AuSPE (black), Aβab-MNG modified AuSPE (blue) and Aβab-MNG modified AuSPE reacted with 5 pg mL−1 of Aβ42 (red).

