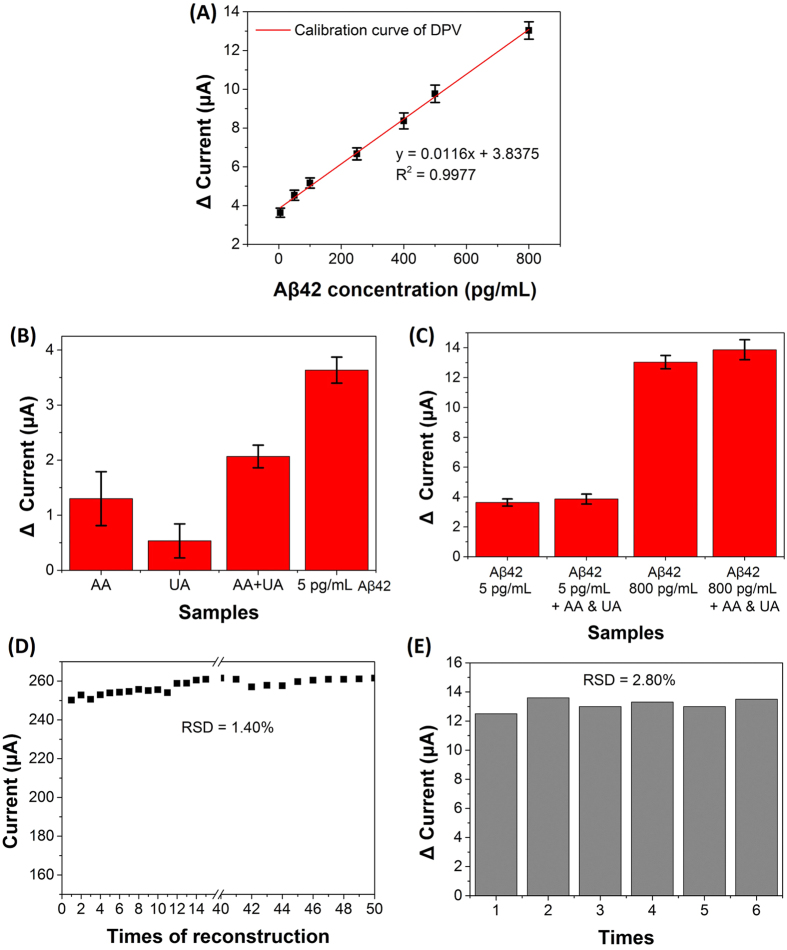
Figure 8.
(A) Calibration curve for detection of Aβ42 from 5 to 800 pg mL−1. (B) Change in current of various interference species. (C) Change in current of Aβ42 detection with or without interference species. Error bars represent the standard deviation (SD) from three independent determinations. (D) Reusability of the Aβab-MNG modified AuSPE biosensor. (E) The change in current for the detection of 800 pg mL−1 Aβ42.

