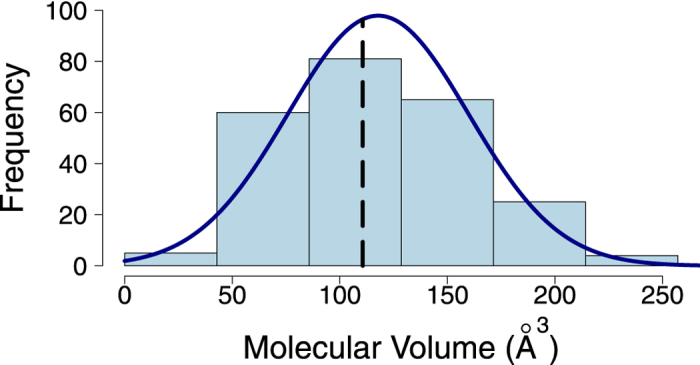
Figure 2. The graph shows the density function of molecular volumes, g(v), for all molecules in the DoOR database.

The solid line is a Gaussian fit (Eq. 5), and the dashed line shows the median, which is slightly different from the mean.

The solid line is a Gaussian fit (Eq. 5), and the dashed line shows the median, which is slightly different from the mean.