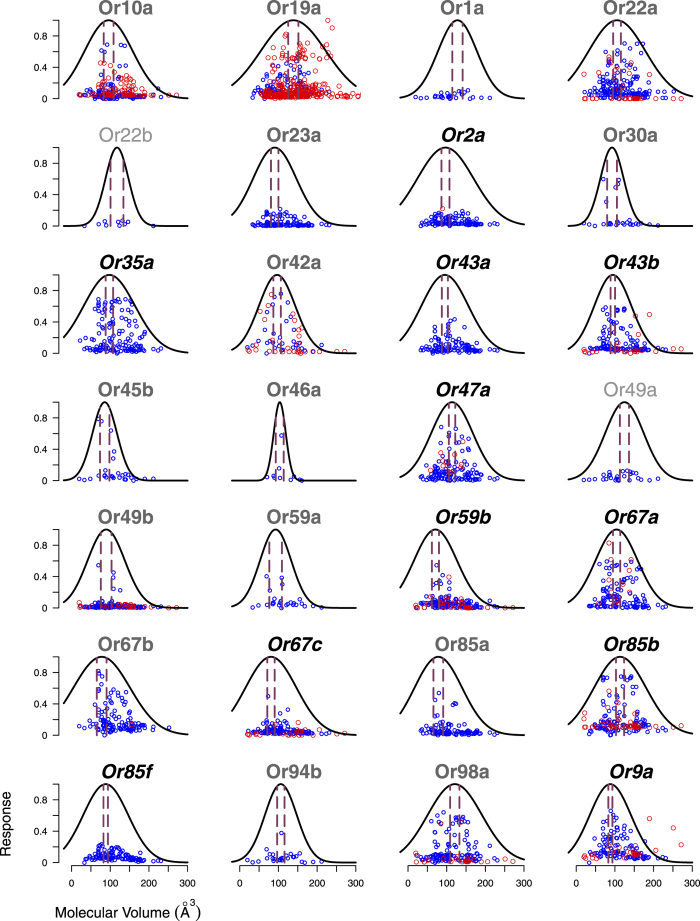
Figure 3. The response of ORs versus the molecular volume of odorants (circles).
The fitted functions fn(v) from Eq. 1 (solid lines) and the error bars of the mean of fn(v) (red vertical lines) for 28 ORs showed that their responses were significantly dependent (p-value < 0.05) on molecular volume. Except 2 (ORs name in light gray), 26 were significant according to the FDR correction (ORs named in gray), and 11 were significant according to the Bonferroni correction (ORs with names in black). The function fn(v) was calculated based on data from the DoOR 1.0 database (blue circles). The red circles are additional data from the DoOR 2.0 database.

