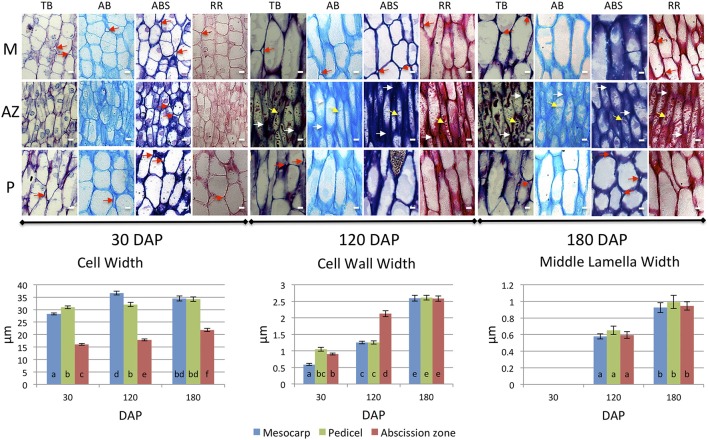
Figure 3.
Development of mesocarp (M), AZ and pedicel (P) cells compared provides evidence for differences in cell wall assembly. Upper images, longitudinal sections of the oil palm fruit base were stained with toluidine blue (TB), alcian blue (AB), alcian blue and periodic acid-Schiff (ABS), or ruthenium red (RR) as indicated. White arrows, cell wall thickenings at tips of adjacent AZ cells; red arrows, intercellular space openings; yellow arrows, intracellular material; DAP, days after pollination; Scale bars are 10 μm. Graphs below: measurements of M, AZ and P cell, cell wall, and middle lamella widths during development. Different lower case letters represent statistically significant differences. The error bars represent standard error.

