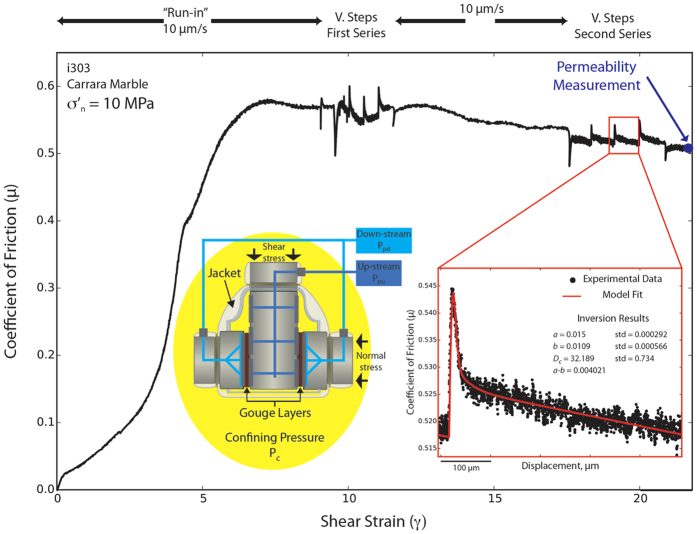
Figure 1. Friction experiments.
Coefficient of friction vs. shear strain, γ, for one representative experiment on Carrara marble gouge. Velocity steps, for the characterization of the rate and state friction parameters, are conducted after about 7–10 γ (i.e 1 cm of shear displacement) and 17–21 γ (i.e. 2.5 cm of displacement). Permeability measurements are performed at the end of shearing. The inset in red shows the detail of one velocity step with the comparison between experimental data (black) and the result from the inversion model (red) used to obtain the (a-b) and Dc values. The yellow inset shows a schematic representation of the double direct shear configuration with forcing blocks equipped with fluid pressure conduits and the jacket to separate fluid pressurized gouge layers from the confining medium (details in the method).

