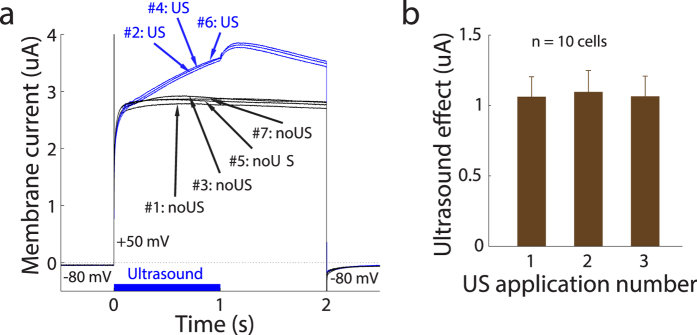
Figure 2. Robust and repeatable effects of ultrasound on transmembrane currents flowing through cells expressing TREK-1.
(a) The current flowing through the membrane of an example cell as a function of time. The membrane voltage was held at −80 mV before stepping to +50 mV (time 0). After 2 s, the membrane voltage returned to −80 mV. To test the repeatability of the US effects, we alternated conditions without and with US in the following sequence: #1: noUS, #2: US, #3: noUS, #4: US, #5: noUS, #6: US, #7: noUS with a 5 s period between the repetitions. The corresponding current waveforms are labeled in the figure. In the US conditions, the US was applied at time 0 and lasted 1 s (see blue bar on the bottom). The driving US waveform was sinusoidal with frequency of 10 MHz and spatial-peak pressure amplitude of 240 kPa (2.0 W/cm2). The figure shows the raw recorded currents. (b) Mean ± s.e.m. ultrasound effect, i.e., US minus noUS currents, for the three consecutive applications of the US. The currents were measured between 1.0 s to 1.2 s following the stimulus onset. This plot is based on 10 cells using spatial-peak US pressure amplitude of 240 kPa (2.0 W/cm2) and membrane voltage of +50 mV.

