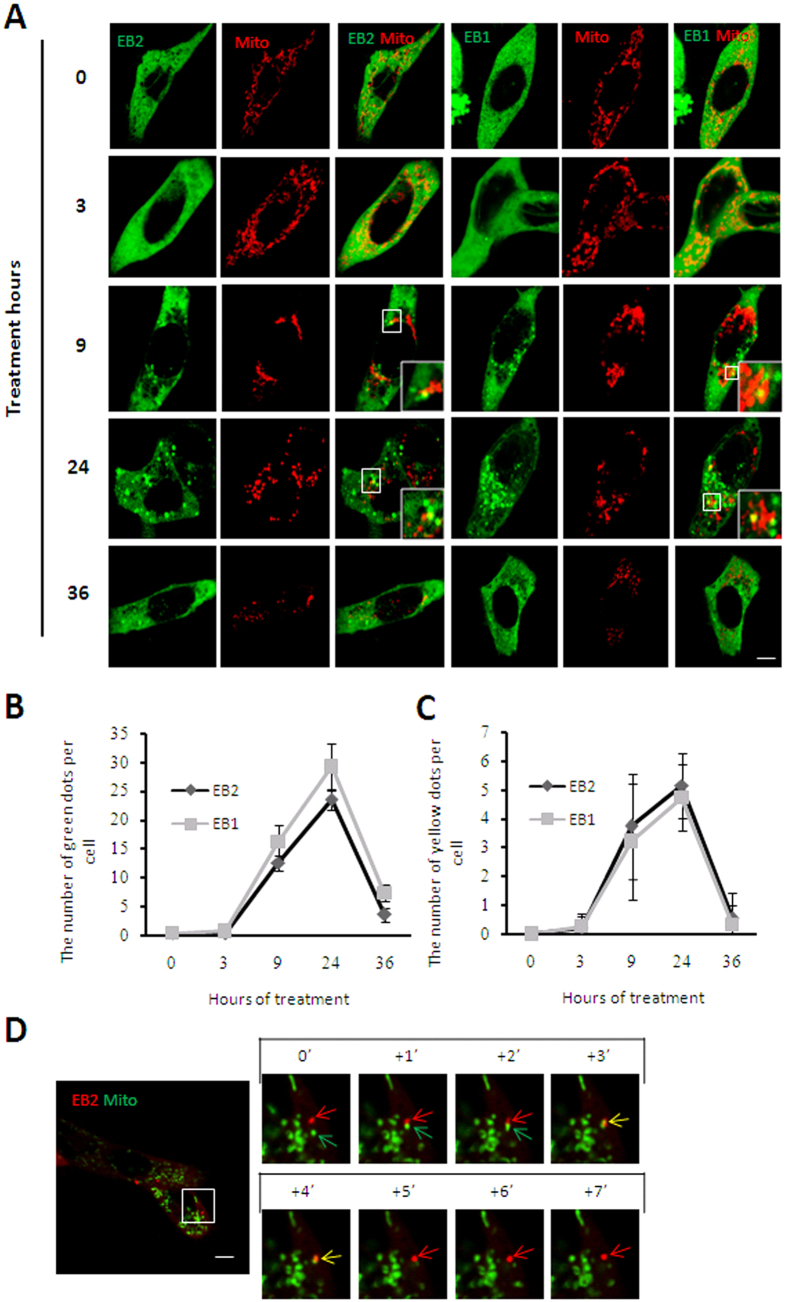
Figure 2. EB2 translocates to mitochondria under mitophagic stress.
(A–C) EB2 aggregated into foci and partially translocated to mitochondria in response to CCCP treatment. HeLa (Parkin-flag expressed) cells expressing mitochondria-DsRed (red) and CFP-EB1 or CFP-EB2 (green) were treated with 20 μM CCCP for the indicated times and analyzed using confocal laser scanning microscope. Magnified images are shown in the insets. Scale bar, 5 μm. The number of GFP positive dots per cell and the number of co-localization with mitochondria (the number of yellow dots) per cell are shown in panels (B,C), respectively (n = 19, mean ± SD). (D) Single foci of EB2 translocated to fragmented mitochondria under CCCP treatment. HeLa (Parkin-flag expressed) cells co-expressing DsRed-EB2 (red) and mitochondria-GFP (green) were treated with 20 μM CCCP for 12 h and then analyzed by time-lapse fluorescent microscopy at 1-s intervals. Red, green and yellow arrows indicate EB2, fragmented mitochondria, and double-positive signals, respectively.

