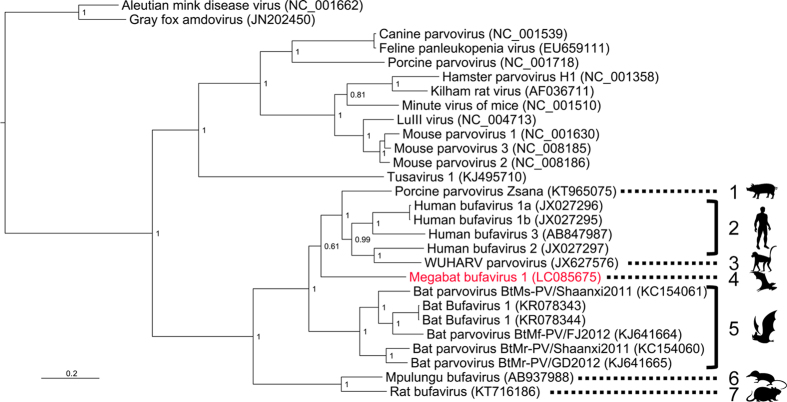
Figure 3. Phylogenetic analysis based on the VP2 gene.
The sequence identified in this study is coloured in red. The respective GenBank accession numbers of the viral sequences are shown in parentheses. Bayesian posterior probabilities are indicated at each node. The scale bar represents a distance of 0.2 substitutions per site. Images were provided by Ms. E. Hayashi with permission.

