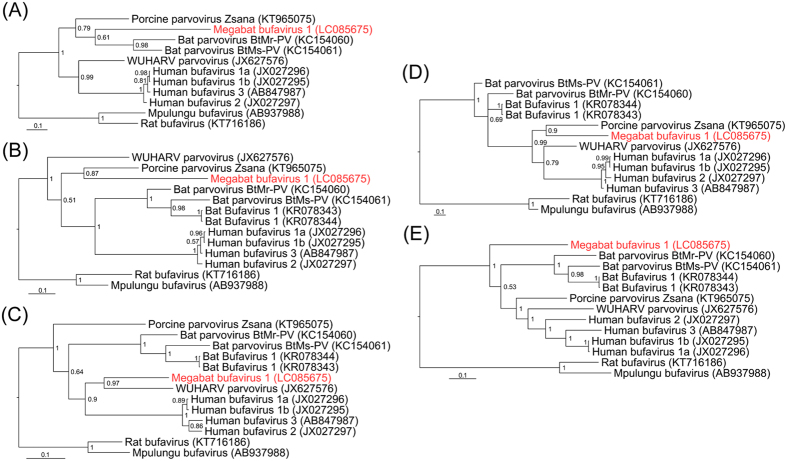
Figure 5. Separate phylogenetic analyses of five regions bordered by putative recombination breakpoints.
Phylogenetic trees were inferred from nucleotide positions 1–778 (A) 778–1219 (B) 1219–1856 (C) 1856–2384 (D) 2384–4765 (E) on the megabat bufavirus 1 genome. The respective GenBank accession numbers of the viral sequences are shown in parentheses. Bayesian posterior probabilities are indicated at each node. The scale bars represent a distance of 0.2 substitutions per site.

