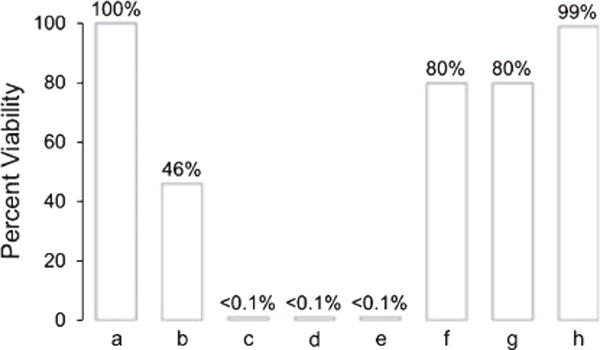
Figure 3.

Percent survival of Escherichia coli cells (initial concentration = 1.1 × 10⁷ to 4.4 × 10⁸ cells mL−1, 0.1 mL, pH = 7) in aqueous media. Each bar represents an average of two to three runs. (a) The values are shown as the increase in cell numbers relative to blanks containing the same initial E. coli cell concentration without introduction of the singlet oxygen generator tip. Escherichia coli inactivation in the presence of (b) the FOSG delivering 473 nm light and 40 psi O2 over a 1 h period; (c) the FOSG delivering 473 nm light and 40 psi O2 over a 2 h period; (d) the heterogeneous PVG sensitizer irradiated externally with 473 nm light over a 1 h period; (e) the homogeneous sensitizer 1 in the presence of oxygen and 473 nm light over a 2 h period; (f) sparging 20 μL min−1 oxygen in the dark over a 2 h period; (g) sparging 20 μL min−1 oxygen with 473 nm laser light over a 2 h period; and (h) the heterogeneous PVG sensitizer in the dark over a 2 h period.
