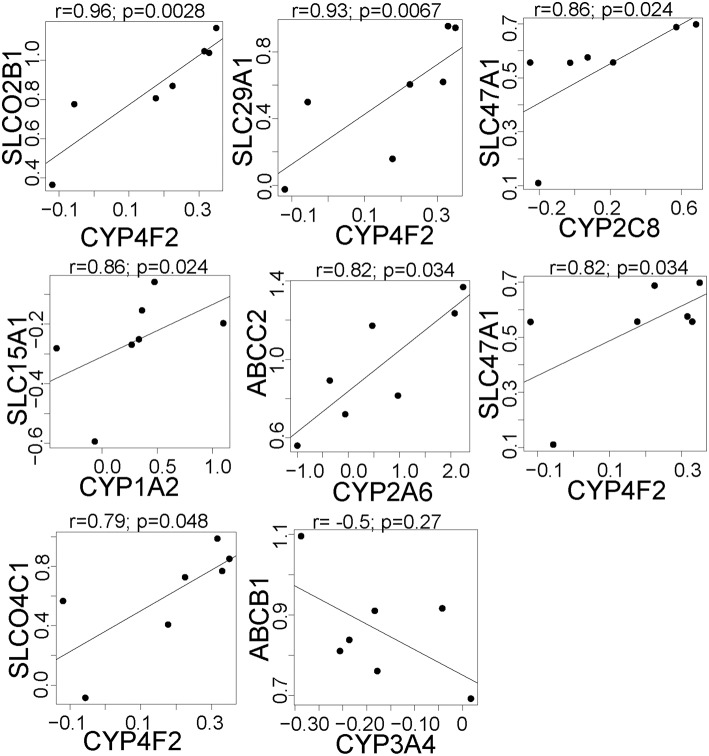
Figure 3.
The significant correlations between the expression of drug metabolism genes and clinically relevant transporter genes that are regulated by rifampin. The expression [represented by log2fold change (Log2FC)] after rifampin treatment was correlated between all CYP and 410 transporters genes. The figure illustrates, the seven significant positive and one significant negative correlations between the expression of CYP and drug transporter genes that were regulated by rifampin with an FDR < 0.05. These were the only correlations with a p < 0.05 by Spearman correlation. Spearman correlation was performed because an assumption of normal distribution could not be made.

