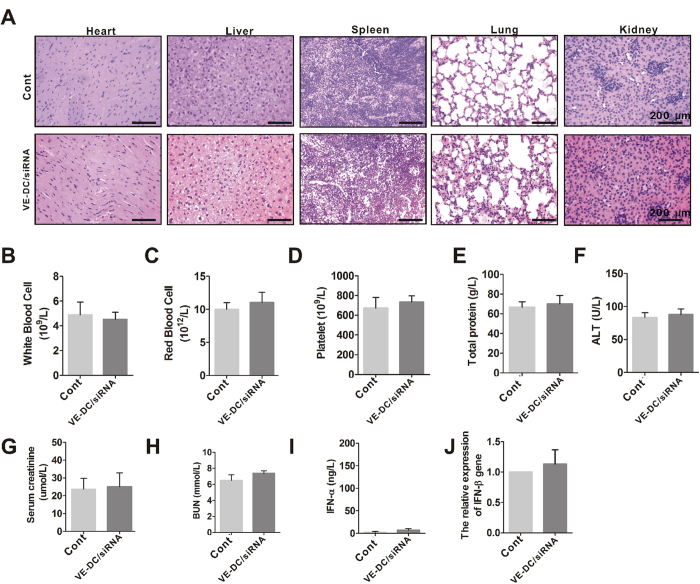
Figure 6. In vivo side effects of the VE-DC/siRNA.
(A) Representative histopathology for different organs in mice treated with and without VE-DC/siRNA for 24 h by hematoxylin-eosin staining (H-E). Blank scale bars = 200 μm. (B) Blood samples were drawn from orbit in mice treated with and without VE-DC/siRNA for 24 h and WBC levels were assessed. Values shown are means ± SD (n = 8/each group). (C) RBC from mice treated with and without VE-DC/siRNA was assessed Values shown are means ± SD (n = 8/each group). (D) Platelets from mice treated with and without VE-DC/siRNA were assessed. Values shown are means ± SD (n = 8/each group). (E) Total protein levels from mice treated with and without VE-DC/siRNA were assessed. Values shown are means ± SD (n = 8/each group). (F) ALT levels from mice treated with and without VE-DC/siRNA were assessed. Values shown are means ± SD (n = 8). (G) Creatinine levels from mice treated with and without VE-DC/siRNA were assessed. Values shown are means ± SD (n = 8/each group). (H) BUN levels from mice treated with and without VE-DC/siRNA were assessed. Values shown are means ± SD (n = 8/each group). (I) ELISA analysis for serum IFN-a level derived from mice treated with and without VE-DC/siRNA for 3 h. Values shown are means ± SD (n = 5/each group). (J) Real-time PCR analysis of IFN-β gene expression from mice (n = 5/each group) treated with and without VE-DC/siRNA for 3 h.

