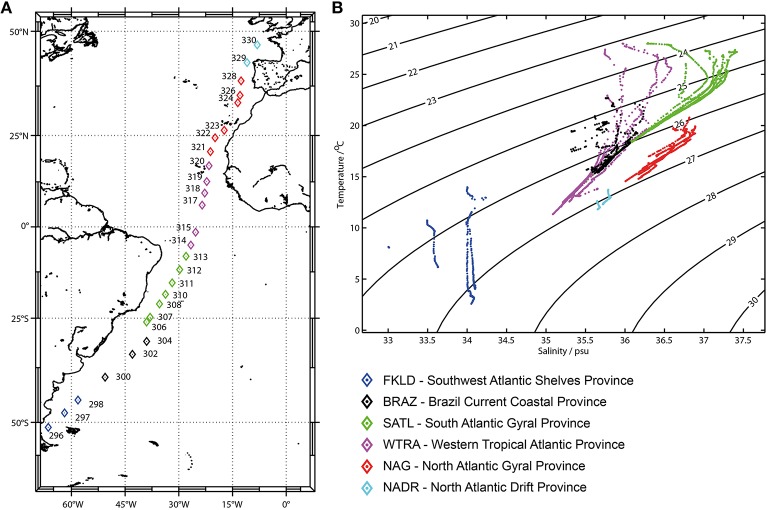
Figure 1.
Sampling sites and oceanographic provinces: (A) Sampling sites. Color codes display the six oceanographic provinces identified in the temperature-salinity (TS) diagram (B). The six oceanographic provinces were defined on the basis of similar properties (temperature and salinity) of the first 200 m of the water column.

