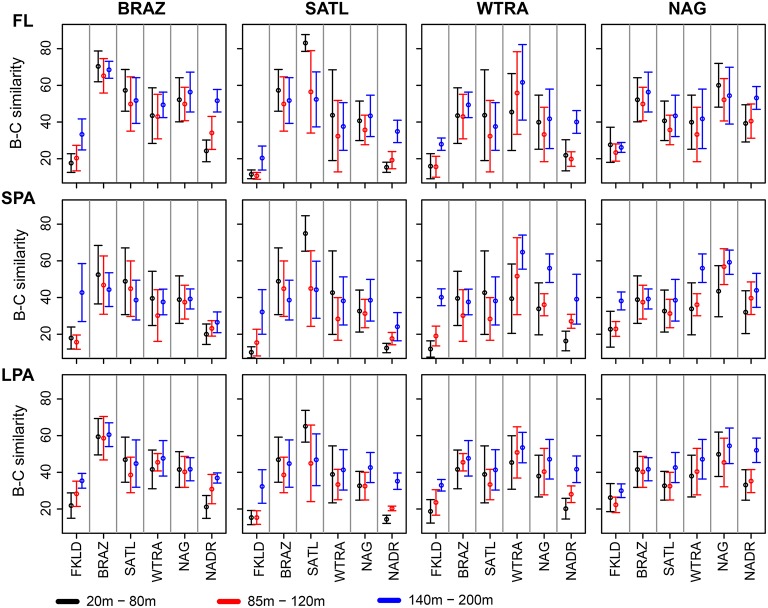
Figure 5.
Province similarity along the water column. Bray-Curtis similarity was calculated on standardized abundances data. The data were combined into three depth layers: 20–80, 85–120, and 140–200 m for the four intermediate provinces: BRAZ, SATL, WTRA, and NAG. The two marginal provinces FKLD and NADR are showed separately (Figure S4) because of the small number of samples for the 140–200 m depth layer. The average of the Bray-Curtis similarity was calculated for each depth layer of the provinces, and compared against all six provinces. From left to right: BRAZ, SATL, WTRA, and NAG are displayed while from top to bottom the three size fractions of the plankton are shown. The color key shows different depth layers.

