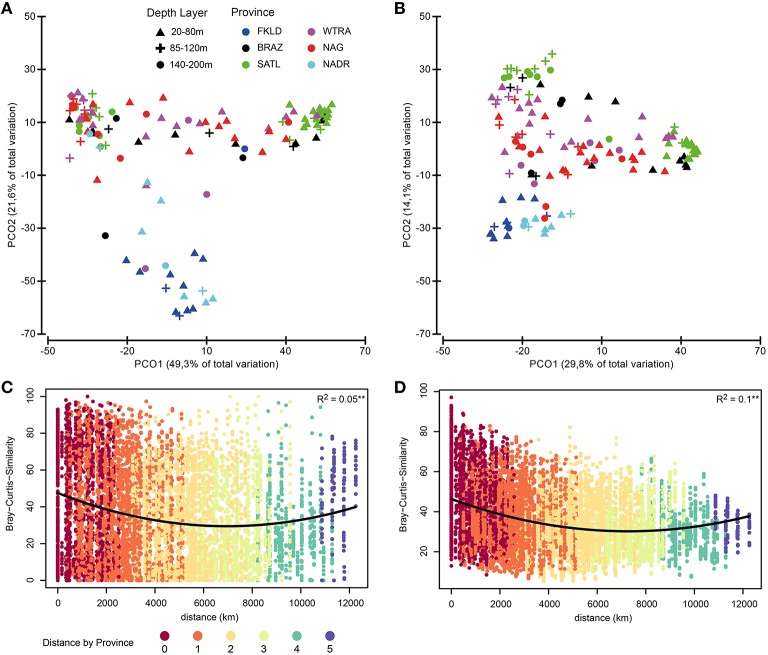
Figure 6.
Biogeography of photosynthetic micro-eukaryotes. Biogeographical patterns were investigated for the small subunit of RNA sequences from chloroplasts. Bray-Curtis similarity was calculated for standardized abundance data at the OTU level for the SP (small particles) community (left panel, A) and the LP (large particles) community (right panel, B). Color code discriminate the six oceanographic provinces, while depth layers are shown with different symbols. In panels (C,D) the distance-decay relationship for SP and LP communities is displayed. For those two panels the color key indicates the distance between samples (pairwise) express of oceanographic provinces.

