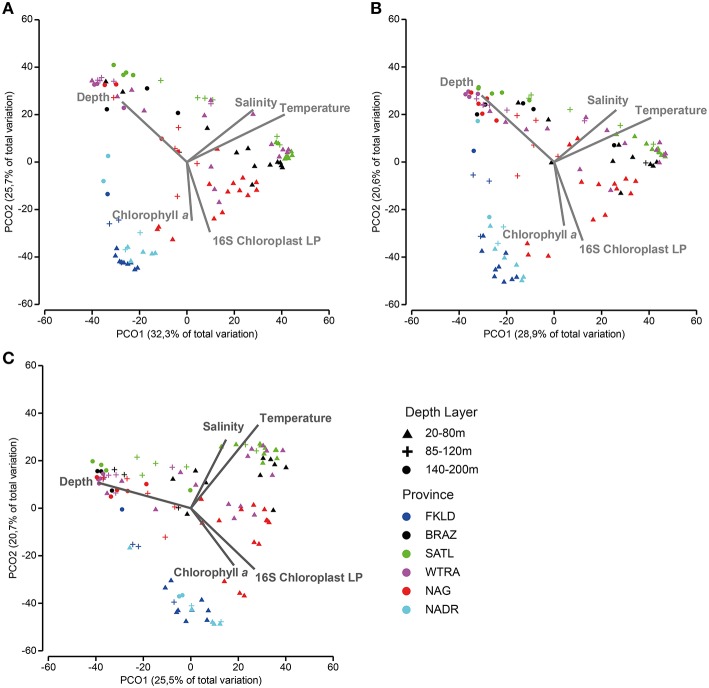
Figure 7.
Beta diversity patterns are shaped by environmental parameters and phytoplankton communities. Principal coordinate analysis was used to show similarities among samples: (A) (FL), (B) (SPA), and (C) (LPA). In order to assess the effect of environmental parameters on the structure of the plot, Pearson correlation was calculated with the principal coordinates, after Bray-Curtis similarity was calculated on standardized abundance data at the OTU level. Only correlation higher than 0.4, with the first two axes were displayed on the chart area. The total amount of samples was reduced to match the biological data (bacterial abundances) with the environmental data (temperature, salinity, depth, and chlorophyll a) and with the relative abundance of phytoplankton (SP and LP). Color codes discriminate oceanographic provinces, while depth layers are shown with different symbols.

