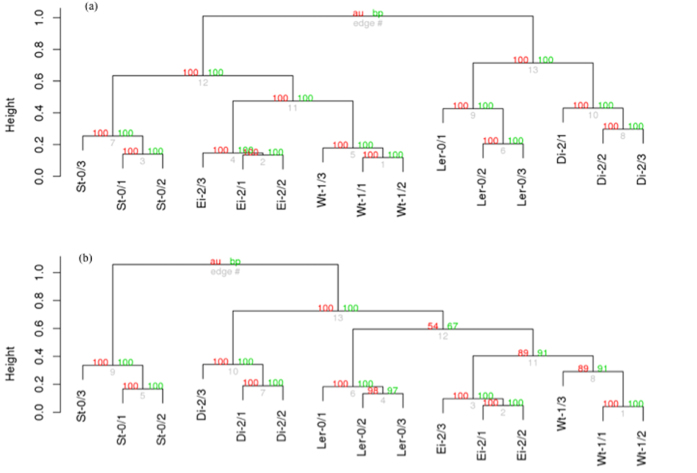
Figure 1. Similarity in the response of local host to their local viruses.
(a) Dendrogram grouping transcriptomic responses to infection with each of the evolved viruses on their corresponding local hosts. (b) Dendrogram grouping functional profiles obtained after infecting each of the evolved viruses on their corresponding local hosts. Red numbers represent the approximately unbiased support of each cluster (percentage P-value) computed by multiscale bootstrapping. Green numbers represent the support of each cluster based on a standard bootstrapping. Grey numbers indicate the node label.

