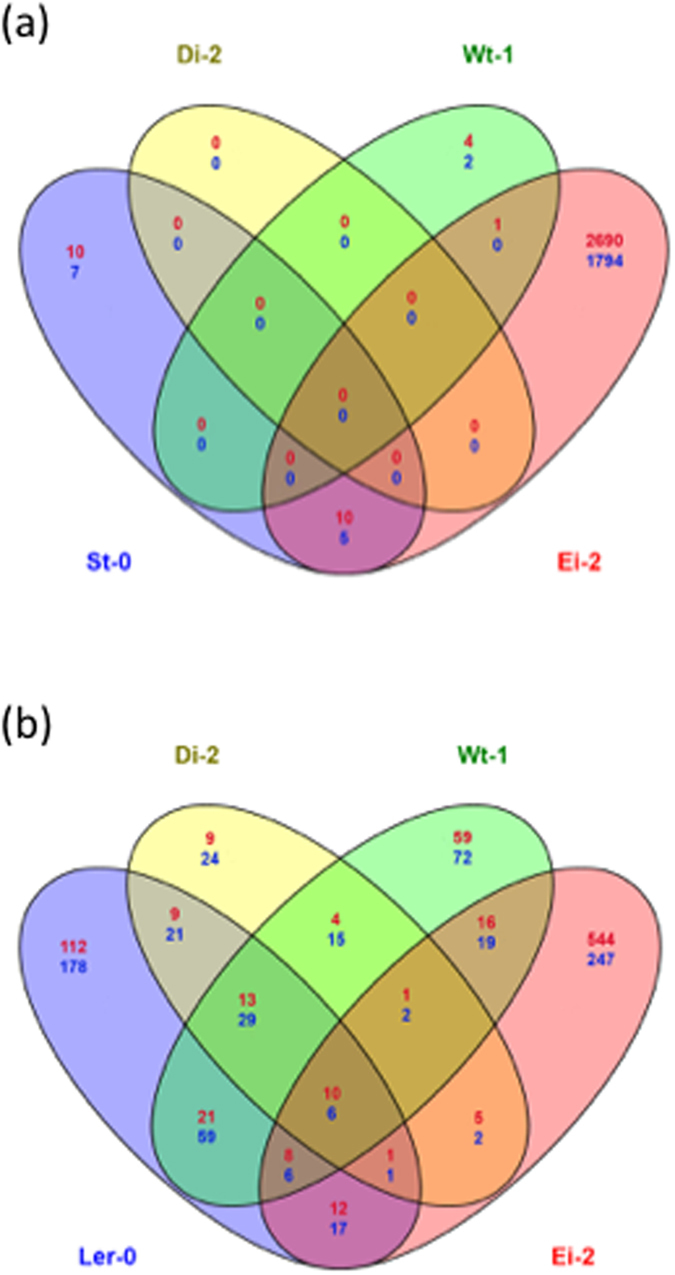
Figure 5.

Venn diagrams illustrating the similarities in gene expression patterns across host ecotypes upon infection with (a) the most generalist virus lineage Ler-0/1 and (b) the most specialist virus lineage St-0/3. In red, number of over-expressed genes; in blue number of under-expressed genes.
