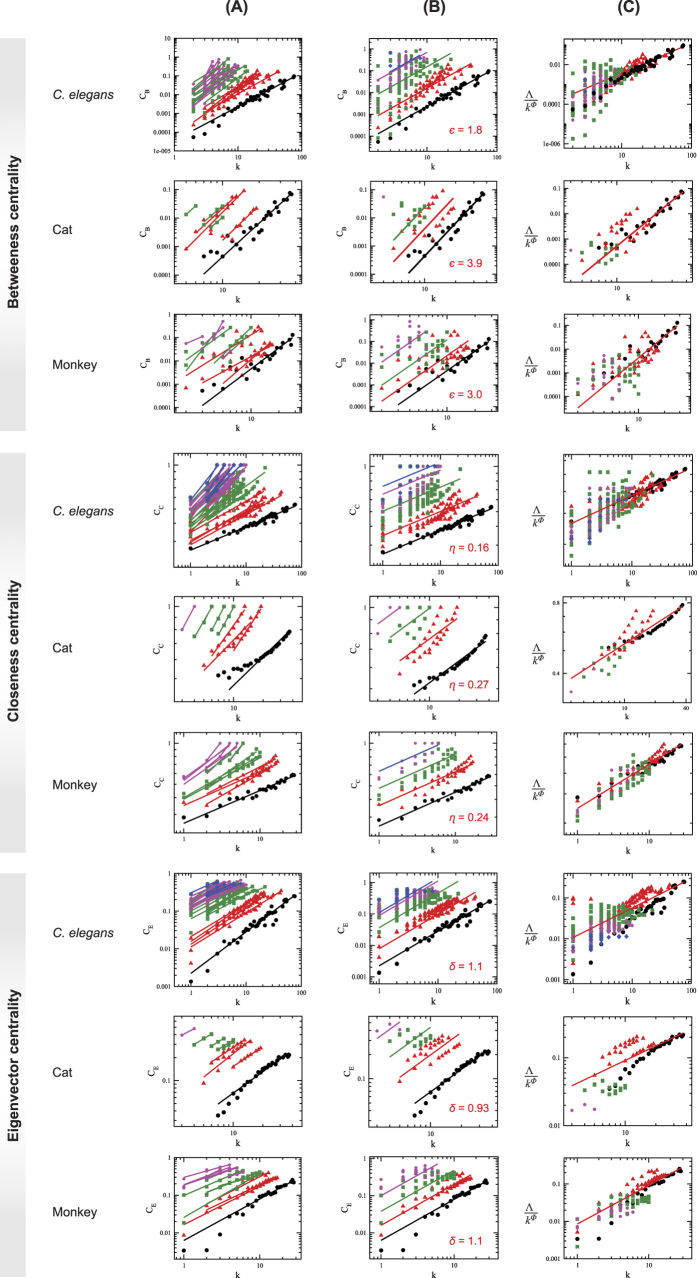
Figure 8.
Scaling in centrality parameters of brain networks of C. elegans, cat, and monkey species: (A) centrality measures of all modules and sub-modules at various levels of the brain networks, (B) power-law fits on distribution of the centrality measures of each level, and (C) scaled centrality data of all modules and sub-modules into a single curve. The first three upper rows of panels are for betweenness centrality, next three rows are for closeness centrality, and last three rows are for eigenvector centrality of the three species.

