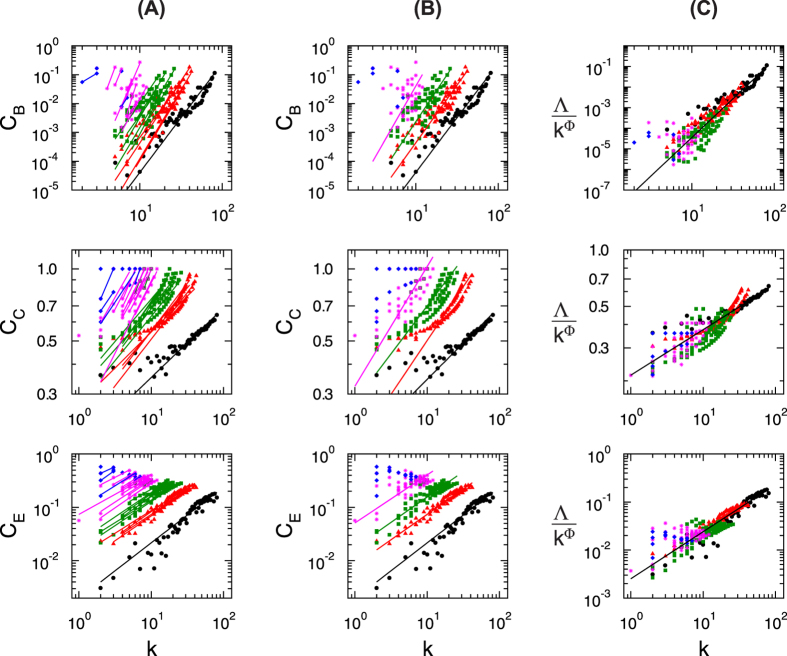
Figure 9.
Scaling in centrality parameters of the brain network of human species: (A) centrality measures of all modules and sub-modules at various levels of organization, (B) power-law fits on distribution of the centrality measures of each level, and (C) scaled centrality data of all modules and sub-modules into a single curve. First, second, and third rows of panels represent the characteristics of betweenness centrality, closeness centrality, and eigenvector centrality of the species, respectively.

