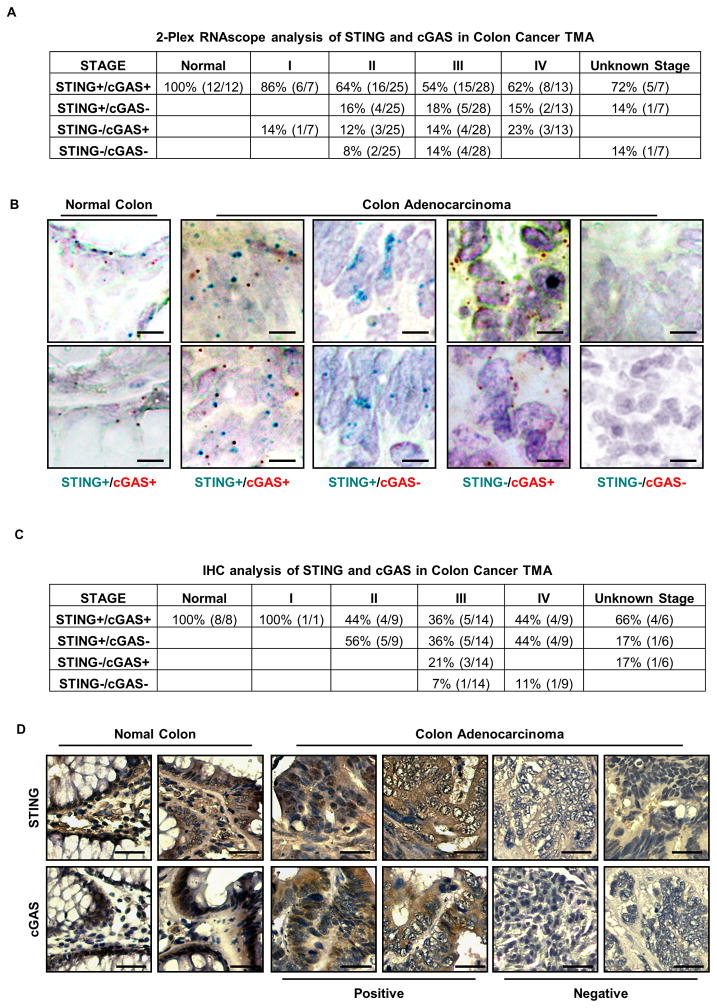
Figure 6. RNA in situ hybridization analysis in colon cancer tissue microarray.
(A) RNA CISH analysis of STING and cGAS expression in a human colon cancer TMA. STING and/or cGAS expression status in each tissue is summarized in the table. (B) Representative images of A are shown at 400X. Bar size, 20μm. (C) IHC analysis of STING or cGAS expression in a human colon cancer TMA. Expression status is summarized in the table. (D) Representative images of C are shown at 200X. Bar size, 50μm. See Also Figure S5.

