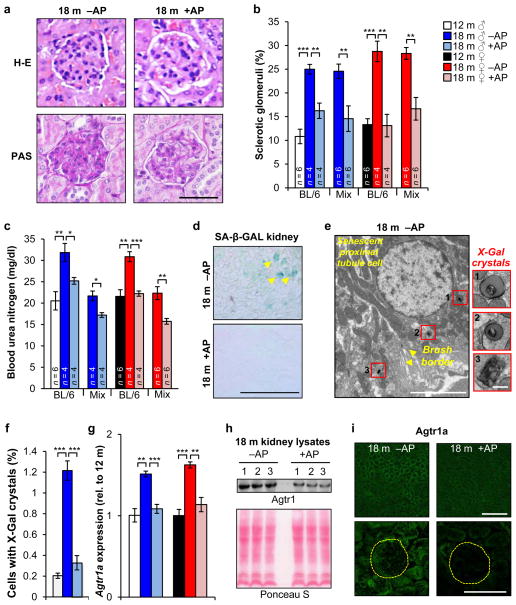
Figure 4. Senescent cells cause glomerulosclerosis, kidney dysfunction and renal RAAS hyperactivity.
a, Images of sclerotic (left) and normal (right) glomeruli from the indicated mice. b, Quantification of sclerotic glomeruli. c, Measurements of blood urea nitrogen levels. d, SA-β-Gal-stained kidney sections. e, Electron micrograph showing a X-Gal crystal-containing renal epithelial cell with brush border membrane (arrowheads). Insets show X-Gal crystal close-ups. f, Percent of cells with X-Gal crystals in renal sections (n = 5 TEM grids for each treatment group). g, Renal expression of Agtr1a analyzed by qRT-PCR (n = 4 mice per group). h, Western blot of kidney lysates probed for Agtr1a (n = 3 mice per treatment group). Ponceau S staining served as loading control. i, Immunostaining of kidney sections for Agtr1a. Yellow circles denotes glomeruli. Scale bars: 50 μm in a; 250 μm in d; 5 μm (main panel) and 200 nm (insets) in e; 100 μm (top) and 50 μm (bottom) in i. Legends in c, f and g are as in b. Error bars indicate s.e.m. Statistical significance was determined by unpaired two-tailed t tests in b, c, f, and g. *, P<0.05; **, P<0.01; ***, P<0.001. For gel source data, see Supplementary Fig. 1. All mice in d–i were C57BL/6 ATTAC. +AP, AP-treated mice, –AP, vehicle-treated mice.

