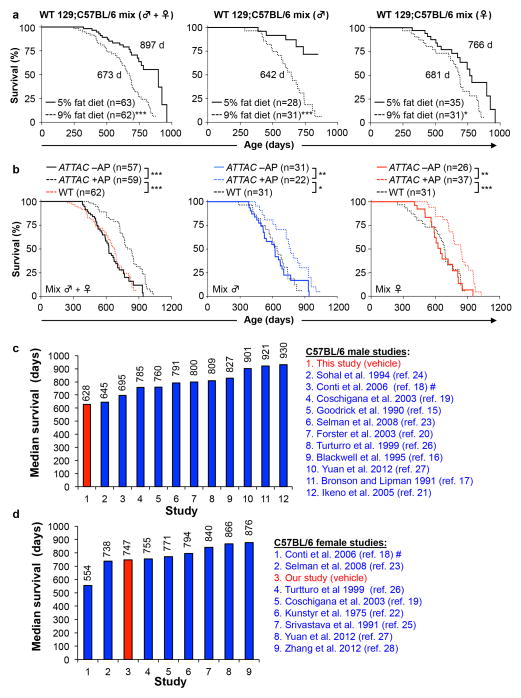
Extended Data Figure 4. Comparison of lifespans under different diets and housing facilities.
a, Survival curves of unmanipulated wild-type 129Sv-C57BL/6 mice fed a 5% versus 9% fat diet. Median lifespan (in days) are indicated. b, Survival curves of unmanipulated wild-type 129Sv-C57BL/6 mice fed 9% fat diet plotted against those of vehicle- (-AP) and AP-treated (+AP) 129Sv-C57BL/6-FVB ATTAC mice from Fig. 2b. These data suggest that the lifespans of vehicle-injected 129Sv-C57BL/6-FVB control mice were quite normal for the diet that they were on and unlikely to be negatively impacted by repeated intraperitoneal injections. Log-rank tests were used to determine statistical significance. *, P<0.01; ** P<0.001; ***, P<0.001. c, d, Median survival data of unmanipulated C57BL/6 male (c) and female (d) mice from various laboratories for comparsion to the results obtained from our facility.

