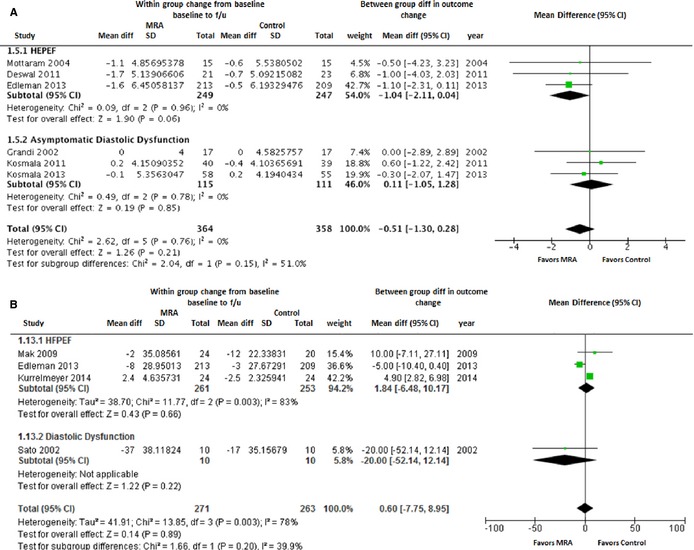
Figure 4.

Forest plot showing the pooled difference between the mineralocorticoid receptor antagonist therapy group and the control group for changes in left ventricular end diastolic diameter (A) and left ventricular mass index (B) from baseline to follow‐up. Results are presented for the pooled analyses of all available studies as well as the subgroups of studies with HFPEF and asymptomatic diastolic dysfunction. CI, indicates confidence interval; HFPEF, heart failure with preserved ejection fraction; MRA, mineralocorticoid receptor antagonist.
