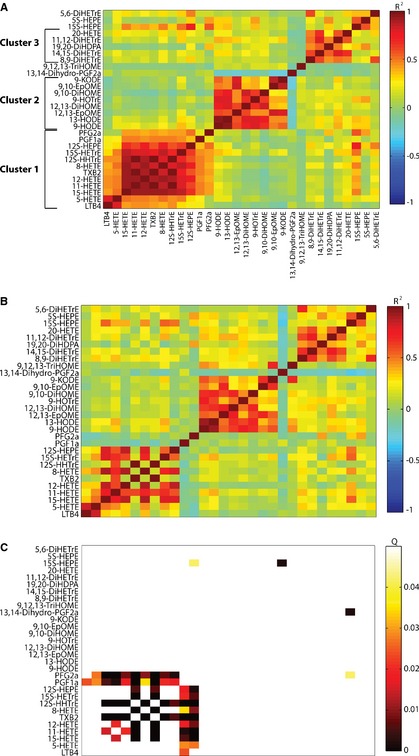
Figure 3.

Correlations between oxylipids. A, Spearman correlation coefficients for correlation between metabolite levels pre‐aspirin in all 156 subjects are displayed. Metabolites were clustered based on Spearman correlation coefficients using modulated modularity clustering algorithm. B, Spearman correlation coefficients for correlation between metabolite levels post aspirin in all 156 subjects are displayed. The clustering order is the same as in Figure 3A. C, Q values evaluating the significance of the change in correlation between metabolites post‐ vs pre‐aspirin are displayed. The clustering order is the same as in Figure 3A.
