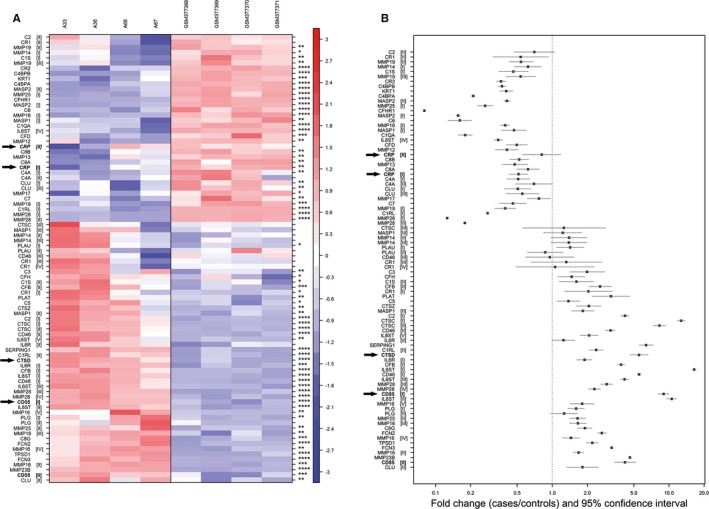
Figure 4.

CTSD and CD55 are present in early valvular cusp lesions (grade 1). A, Gene expression profiles of proteases and complement components. The rows (probe sets) in the heat map were hierarchically clustered (complete linkage) based on Pearson's correlation. Rows were centered to mean 0 and scaled to SD 1. Upregulation and downregulation are shown in red and blue, respectively; expression between is indicated in white. Columns on the left side represent samples of early valvular cusp lesions (A‐33, A‐36, A‐66, A‐67); those shown on the right side are controls (GSM377368, GSM377369, GSM377370, GSM37737118). Each row represents a different probe set tagging a specific protease or complement component indicated on the left. Different probe sets of one specific gene are marked with roman numerals in parenthesis. (*P<0.05; **P<0.01; ***P<0.001; ****P<0.0001). CRP, CTSD and CD55 are highlighted by arrows. For more details, see Table S1. B, Fold‐changes (cases vs controls) and 95% CIs of microarray expression profiles. Genes represented by probe sets that were not significantly differentially expressed between cases and controls and/or low expressed (defined as mean log2 signal intensities <5 in both, cases and controls) are not displayed. Probe sets (y‐axis) are sorted according to (A). Fold‐changes and 95% CIs (x‐axis) are indicated by black squares and vertical lines, respectively. The dashed horizontal line represents a fold‐change of 1 (ie, no difference between cases and controls); fold‐change above (below) indicate an upregulation (downregulation) in cases compared with controls. CRP indicates C‐reactive protein; CTSD, cathepsin D.
