
Figure 1.
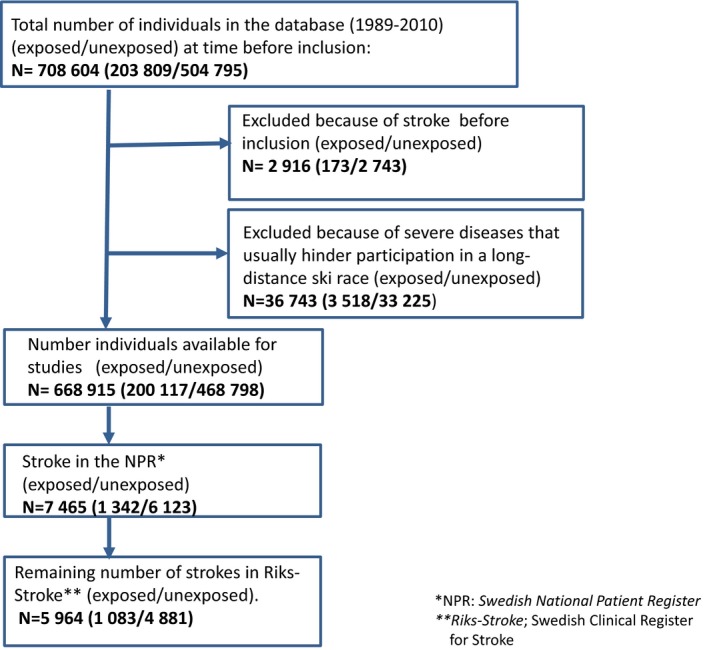
Flowchart describing the total number of individuals in Vasaloppet cohort before and after exclusions. From those avalible for studies the number of first stroke is shown.
Official websites use .gov
A
.gov website belongs to an official
government organization in the United States.
Secure .gov websites use HTTPS
A lock (
) or https:// means you've safely
connected to the .gov website. Share sensitive
information only on official, secure websites.
Flowchart describing the total number of individuals in Vasaloppet cohort before and after exclusions. From those avalible for studies the number of first stroke is shown.