Figure 1.

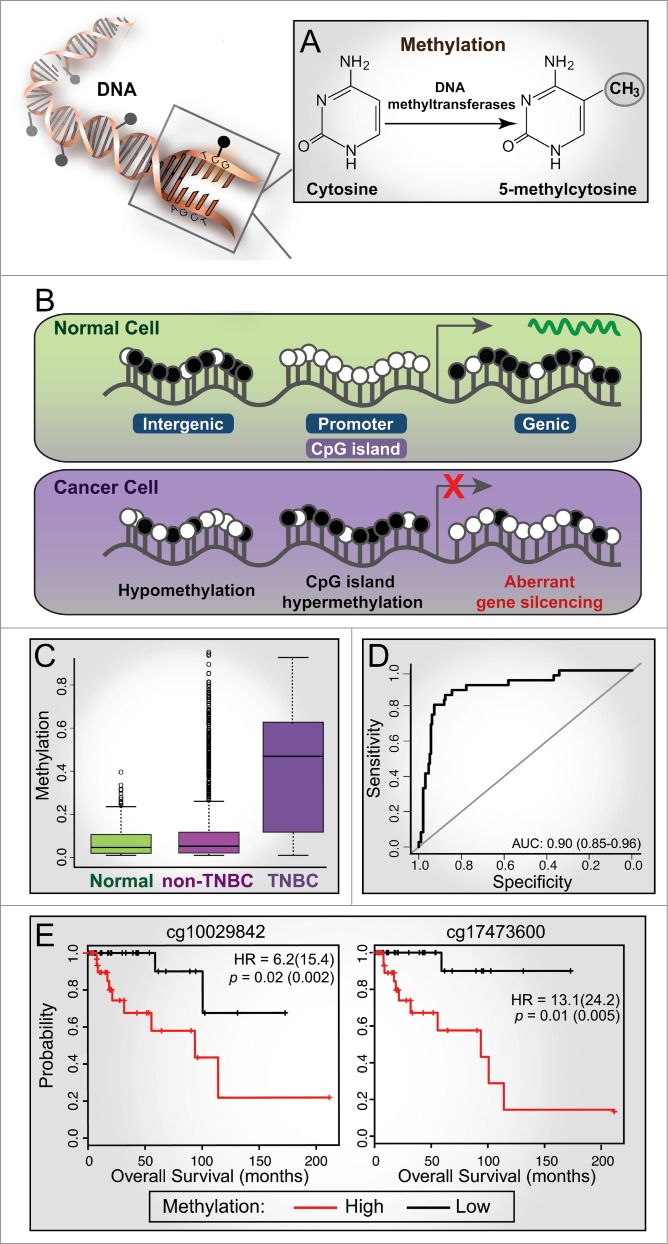
Aberrant methylation in cancer and its diagnostic and prognostic value in triple-negative breast cancer (TNBC). (A) DNA methylation is characterized by the addition of a methyl group to the cytosine base within CpG dinucleotides through the action of DNA methyltransferase enzymes, forming 5-methylcytosine. (B) A schematic representation of methylation changes that typically occur between normal and cancer cells. White circle, unmethylated CpG; black circle, methylated CpG. CpG islands are often associated with gene promoters and are unmethylated in normal cells; gene expression is associated with methylation of adjacent genic regions. In cancer cells, CpG islands are often hypermethylated, resulting in aberrant gene silencing (e.g., tumor suppressor genes) and hypomethylation of adjacent genic and intergenic regions. (C) Box plots showing the distribution of methylation levels for Illumina Human Methylation 450 BeadChip (HM450K) probes across a differentially methylated region (DMR) on chr19-46114 (exon of PPFIA3) showing hypermethylation in TNBC tumors (n = 73) compared to normal (n = 83) and non-TNBC samples (n = 354) from The Cancer Genome Atlas (TCGA) breast cancer cohort. (D) ROC curve analysis based on methylation values of the TNBC-specific probes (n = 282) classifies TCGA HM450K tumor samples into TNBC and non-TNBC with high specificity and sensitivity (AUC of 0.9; sensitivity of 0.72 and specificity of 0.94). (E) Kaplan-Meier plots showing survival curves for TNBC patients stratified based on median β methylation values of 2 HM450K probes (chr1-47207; exon of LHX8); hazard ratios (HR) and p-values from Cox proportional hazard model are shown for univariate analyses (with multivariate values in parentheses).
