
Figure 5.
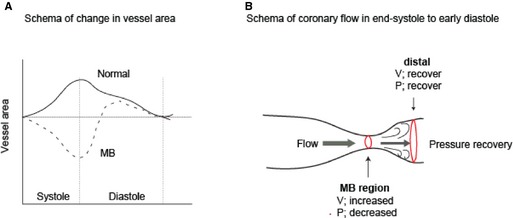
Proposed schematic of ischemia from MB. A, Normal vessels show the pattern in which an increase in area is seen throughout systole with the rise in aortic pressure (solid line). In contrast, MB segments undergo a marked decrease in area, particularly in the second half of systole. Importantly, this vessel compression persists into early diastole (dotted line).3 B, Venturi effect. When fluid is passing the narrow lesion, its velocity increases by the principle of energy conservation, and pressure decreases by the principle of the Bernoulli equation. Distally, the velocity decreases and the pressure increases to recover by the same principles. MB indicates myocardial bridge; P, pressure; V, velocity.