Figure 1.
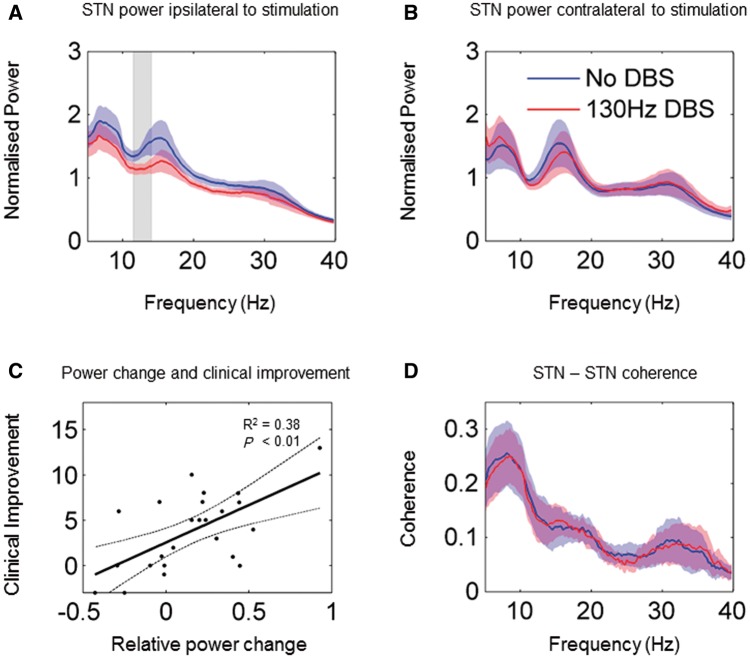
Changes at STN level. ( A ) Group average normalized power spectra of the stimulated STN during the no DBS and the 130 Hz DBS conditions. The shaded regions represent standard errors of the mean. In the no DBS condition spectral peaks are evident in the alpha (8–12 Hz), low beta (13–21 Hz) and high beta (21–30 Hz) frequency ranges. DBS results in a suppression of power in the frequency range indicated by the grey bar (11–14 Hz). ( B ) Group average spectra of the unstimulated STN contralateral to the stimulated side. There are no significant spectral changes associated with DBS. ( C ) Correlation between DBS-related changes in relative power in the 11–14 Hz frequency range across hemispheres and changes in contralateral hemibody akinesia/rigidity scores. A linear regression line is plotted with 95% confidence intervals indicated by the dotted lines. Clinical improvement (no DBS-130 Hz DBS contralateral rigidity/akinesia scores) correlated significantly with suppression of 11-14 Hz power (presented as No DBS-130 Hz DBS; F = 13.6, r 2 = 0.38, P = 0.0013). ( D ) Group average coherence spectra between stimulated and contralateral STNs. Unilateral DBS does not affect coherence between the two STNs.

