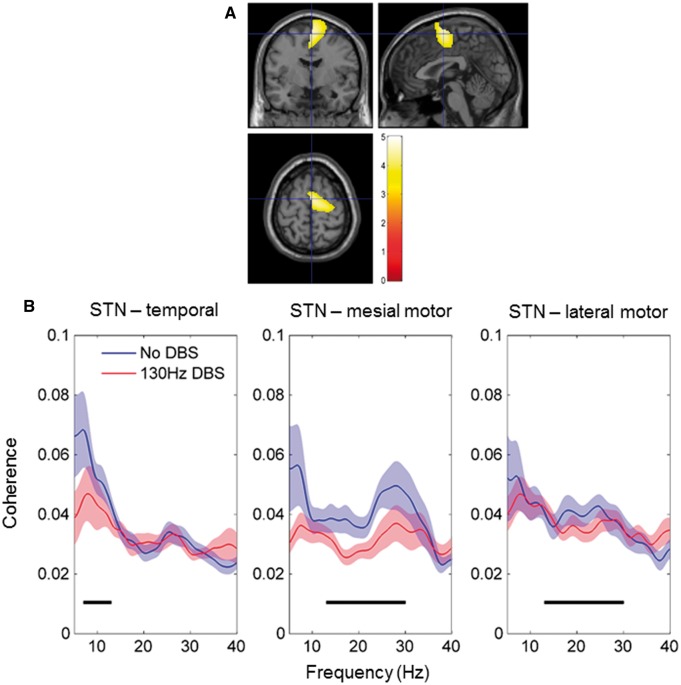
Figure 2.
Effect of 130 Hz DBS on STN-MEG coherence. ( A ) Group thresholded SPM of the simple main effect of DBS on the beta band network. The coloured region indicates areas where DBS significantly suppressed STN-cortical beta band coherence. Values indicated by the colour bar are t -statistics. The SPM is superimposed on a T 1 -weighted canonical MRI with cross-hairs centred on the value of the peak t statistic at MNI co-ordinates 2 −4 64. For the simple main effect of DBS on the alpha band network, no clusters survived correction for multiple comparisons. ( B ) Group mean spectra of coherence computed between the STN and locations of the peak t statistic of simple main effects separately for the alpha and beta networks. Black bars denote alpha (8–12 Hz) and beta bands (13–30 Hz) in the left and right hand side plots, respectively.

