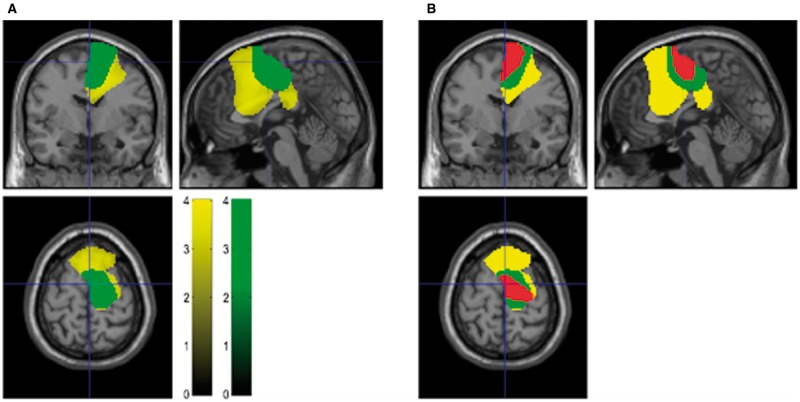
Figure 3.
Differences between STN-MEG coherence in low and high beta bands. ( A ) Thresholded SPMs superimposed onto a T 1 -weighted canonical MRI with region in yellow representing voxels where STN-cortical coupling was significantly greater in the beta band than in the alpha band in the resting block. Region in green represents voxels within the resting beta network where STN-cortical coupling in the high beta frequency range (21–30 Hz) exceeded coupling within the low beta range (13–21 Hz). Colour bars for the yellow and green images represent t-statistics. ( B ) Resting beta network (yellow), high beta network (green) and the cortical region where STN-cortical beta band coupling is suppressed by DBS (red) are all superimposed.

