
Figure 4.
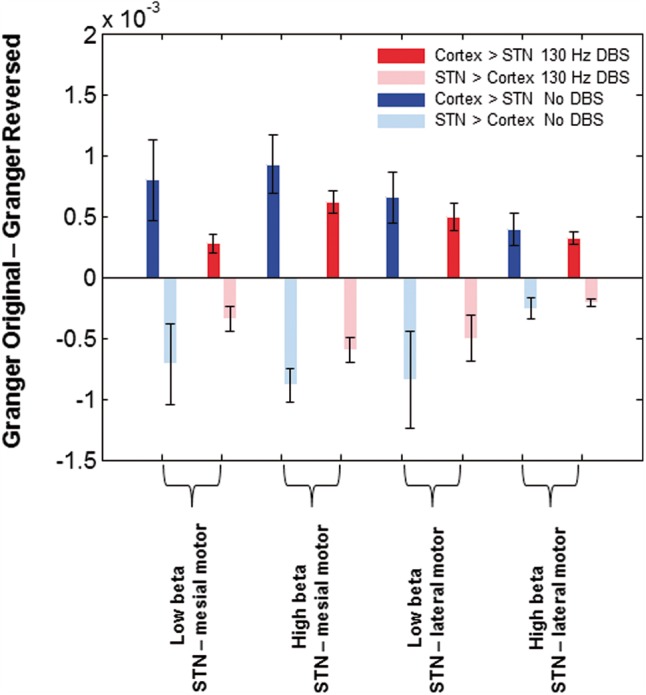
Results of Granger causality analysis. Group mean difference in Granger causality between original and time reversed data in no DBS and 130 Hz DBS conditions for the high and low beta sub-bands. Source time series were extracted from the location of the peak t -statistic of the simple main effect of DBS in the beta band (at MNI co-ordinates 2 −4 64 corresponding to mesial motor regions) and additionally from a source within primary motor cortex (M1), which we term lateral motor. The difference in Granger causality is significantly greater than zero in the direction of cortex leading the STN for both cortical regions in the no DBS and the 130 Hz DBS conditions (see ‘Results’ section).Vertical bars represent standard errors of the mean. In contrast the difference in Granger causality is less than zero in the direction of STN leading the cortex, confirming that cortical activity led that in STN.