
Figure 6.
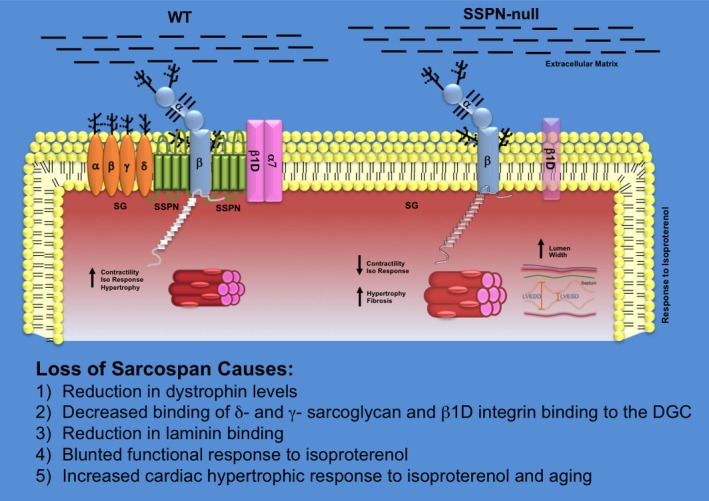
Schematic summarizing effects of SSPN loss in cardiac muscle. A schematic diagram illustrates the changes that occur at the sarcolemma due to alterations in SSPN levels in WT and SSPN‐null (SSPN −/−) mice. Protein levels of the entire DGC as well as β1D‐integrin (light purple) are depicted by changes in color intensity. The sarcoglycans (α‐, β‐, γ‐, δ‐SGs; light orange) are depicted as transmembrane oval shapes. Dystrophin (Dys; white) is shown on the cytoplasmic face of the sarcolemma membrane. Dystroglycan (α‐, β‐ DGs; light blue) levels do not change with SSPN levels. Changes to cardiac muscle fiber cross‐sectional area are shown by increased size. Alterations in left ventricular dimension are demonstrated for SSPN −/− hearts, shown as increased LVEDD and LVESD. Glycosylation is depicted as black branches on both the SGs and DGs. The extracellular matrix containing laminin to which DG associates is depicted as black lines. This schematic summarizes the major consequences of SSPN loss including: (1) reduction in dystrophin levels, (2) almost complete loss of δ‐ and γ‐SG from the sarcolemma, (3) reduction in laminin binding in the extracellular matrix reducing cell‐to‐cell adhesion, (4) blunted functional responsiveness to isoproterenol, and (5) increased hypertrophic response to isoproterenol administration and aging. DGC indicates dystrophin–glycoprotein complex; LVEDD, left ventricular end diastolic dimension; LVESD, left ventricular end systolic dimension; SSPN, sarcospan; WT, wild‐type.