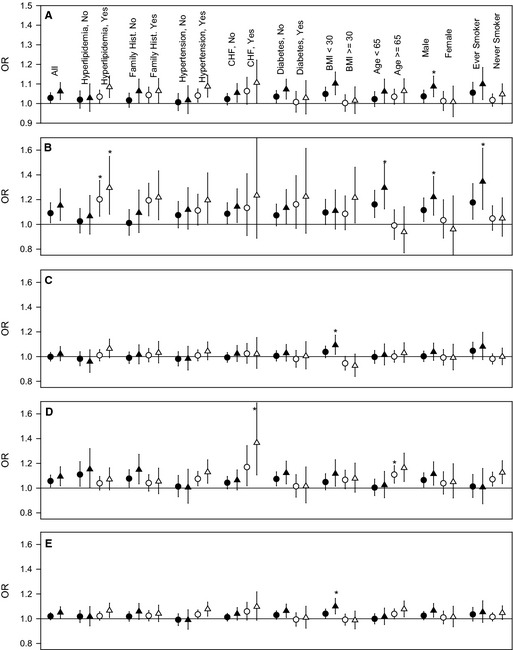
Figure 3.

ORs (and 95% CIs) associated with a 10‐μg/m3 increase in PM 2.5 for all ACS (A), ST‐segment elevation myocardial infarction (B), non‐STEMI (C), unstable angina (D), and non–ST‐segment elevation ACS (E) events for those with coronary artery disease across various strata. Circles represent results from the standard nonthreshold models, and triangles represent results from models with a PM 2.5 threshold of 25 μg/m3. *Strata with a statistically significant (P<0.05) larger effect vs the alternate strata. ACS indicates acute coronary syndrome; BMI, body mass index; CHF, congestive heart failure; Hist., history; OR, odds ratio; PM 2.5, fine particulate matter ≤2.5 μm in aerodynamic diameter; STEMI, ST‐segment elevation myocardial infarction.
