
Figure 2.
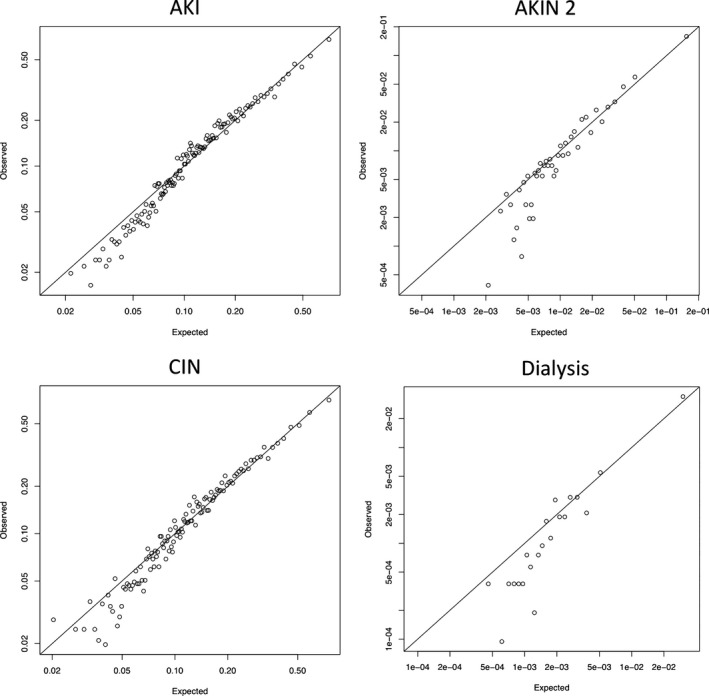
Observed vs expected calibration plots. This figure plots the observed vs expected calibration plots for AKI, AKIN 2, CIN, and dialysis. AKI indicates acute kidney injury; AKIN 2, Acute Kidney Injury Network 2; CIN, contrast‐induced nephropathy.