Fig. 3.

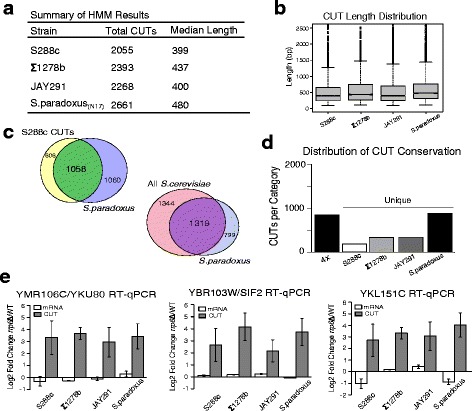
Assessment and validation of conserved CUT expression. a A summary of the HMM identified CUTs in each strain. b Box and whiskers plot showing CUT length distribution for each strain. We note that the y-axis range was limited to a maximum length of 2.5 kb for better comparison of the distributions across the strains. c Venn diagrams showing conserved CUT expression between the S.cerevisiae strain S288c and S.paradoxus (N17) and the conserved CUT expression between all S.cerevisiae strains (S288c, Σ1278b, and JAY291) and S.paradoxus (N17). d Distribution of CUTs with conserved syntenic expression across all four strains (4x) profiled or present in only one strain (unique). e RT-qPCR validation of three 4x conserved CUTs. In each case the candidate CUT is expressed antisense to an annotated gene and qPCR was performed strand-specifically with the same amplicon to distinguish between signal from the mRNA and the antisense CUT. Log2 fold change of rrp6Δ/WT was calculated after normalization to ACT1 (also acquired strand-specifically). In each case the CUT-specific strand shows a significant increase in transcript abundance in rrp6Δ relative to WT while the mRNA-specific strand shows little to no change, except with YKL151C mRNA. All qPCR was performed with biological triplicates and error bars denote standard deviation of fold change by coefficient of variation calculations
