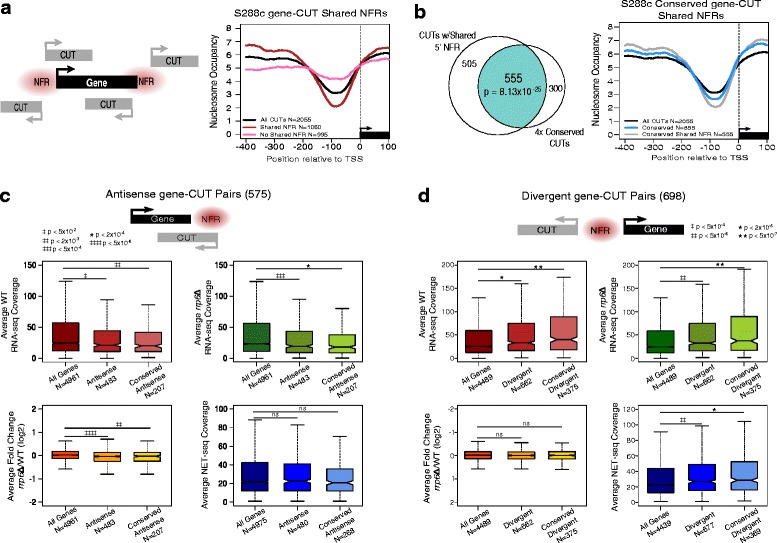
Fig. 4.

Distinct trends of gene expression correlate with CUT expression in specific architectures with genes. a Left: Schematic demonstrating the configurations in which a CUT can originate from a gene NFR. Right: Metagene plot of S288c nucleosome occupancy for a 500 bp window around the TSS of all S288c CUTs identified by our HMM (black), the subset of CUTs found to originate from a gene NFR (red), and the remaining CUTs that do not originate from a gene NFR (pink). b Left: Venn diagram of the overlap of CUTs that originate from a gene NFR and 4x conserved CUTs. Right: Metagene plot of S288c nucleosome occupancy for a 500 bp around the TSS of all S288c CUTs identified by our HMM (black), all of S288c 4x conserved CUTs (blue), and the 4x conserved CUTs that originate from a gene NFR (grey). c Examination of antisense gene-CUT pairs in S288c. Box and whisker plots showing the distribution of average WT (red), rrp6Δ (green), and log2 rrp6Δ/WT (orange) calculated from two S288c RNA-seq biological replicates, and NET-seq coverage from [4] (blue) for all expressed genes with a 3′ UTR annotation, those genes in antisense gene-CUT pairs, and the genes from the subset of antisense gene-CUT pairs with a 4x conserved CUT. All points outside the whiskers (outliers) are not displayed. All p-values are derived from the two-sided KS test. d Examination of divergent gene-CUT pairs in S288c. Box and whisker plots shows the distribution the average WT (red), rrp6Δ (green), and log2 rrp6Δ/WT (orange) calculated from two S288c RNA-seq biological replicates, and NET-seq coverage from [4] (blue) for all expressed genes with a 5′ UTR annotation, those genes in divergent gene-CUT pairs, and the genes from the subset of divergent gene-CUT pairs with a 4x conserved CUT. All points outside the whiskers (outliers) are not displayed. All p-values are derived from the two-sided KS test. Nonsignificant (ns) p-value ≥ 0.1
