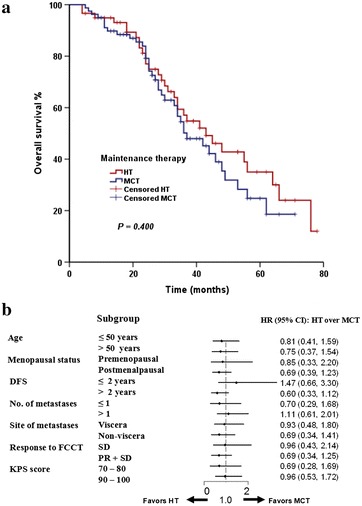
Fig. 2.

Comparison of overall survival between the HT group and the MCT group. a Estimation of overall survival, censored on the date of last assessment. b Forest plot (OS analysis); HR < 1 favors HT. DFS disease-free survival, FCCT first-line capecitabine-based combination chemotherapy, KPS Karnofsky performance status, CR complete response, PR partial response, SD stable disease, HT hormonal therapy, HR hazard ratio, CI confidence interval, MCT maintenance capecitabine monotherapy
