Fig. 3.

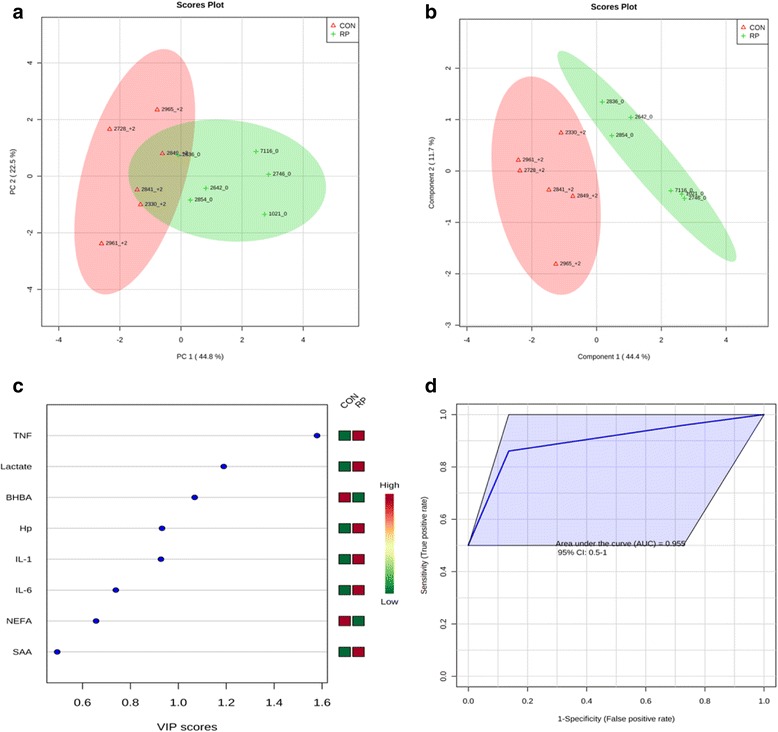
a PCA and (b) PLS-DA of 6 control and 6 RP cows at disease week showing 2 separated clusters for 2 groups. c VIP, and (d) ROC curve of 6 CON and 6 RP cows at disease wk for the top 3 serum variables

a PCA and (b) PLS-DA of 6 control and 6 RP cows at disease week showing 2 separated clusters for 2 groups. c VIP, and (d) ROC curve of 6 CON and 6 RP cows at disease wk for the top 3 serum variables