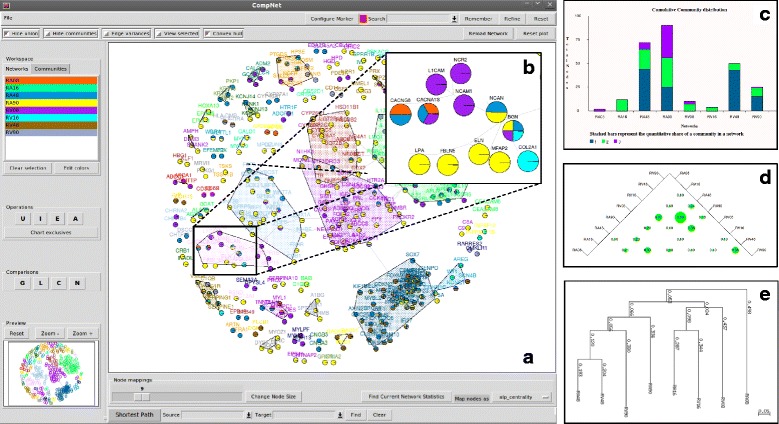
Fig. 1.

(a) CompNet canvas displaying the union of eight protein-protein interaction networks. The names of nodes belonging to different communities are marked with different colors. (b) The ‘pie-nodes’ representation enables to identify presence/absence of individual nodes across the compared networks. (c) The cumulative community distribution plot (d) Bubble chart representing similarity between networks (e) Hierarchical tree built using network similarity
