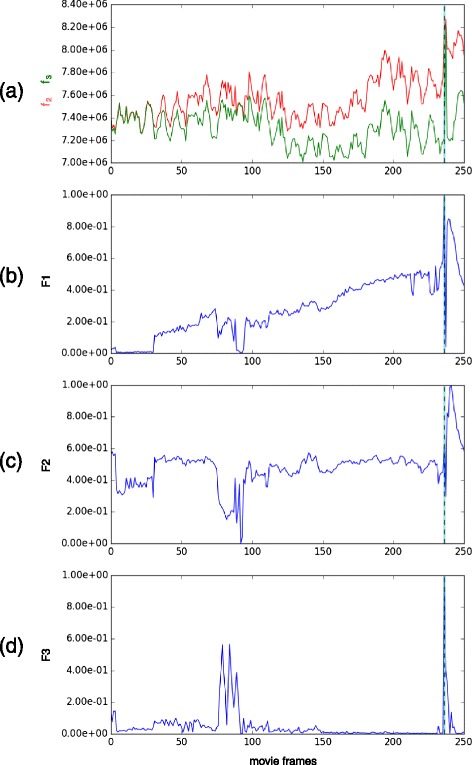
Fig. 6.

Time features F1, F2 and F3 on an example video. The dashed vertical line indicates the event of interest we are seeking to identify when a third cell appears. a residual f2 of the 2-component model in red, f3 of the 3-component model in green and (b) F 1, their ratio. c F 2, the distance between the two closest centers of the 3-components model. d F 3, the variance of the intensity values between the two closest centers of the 3-component model
