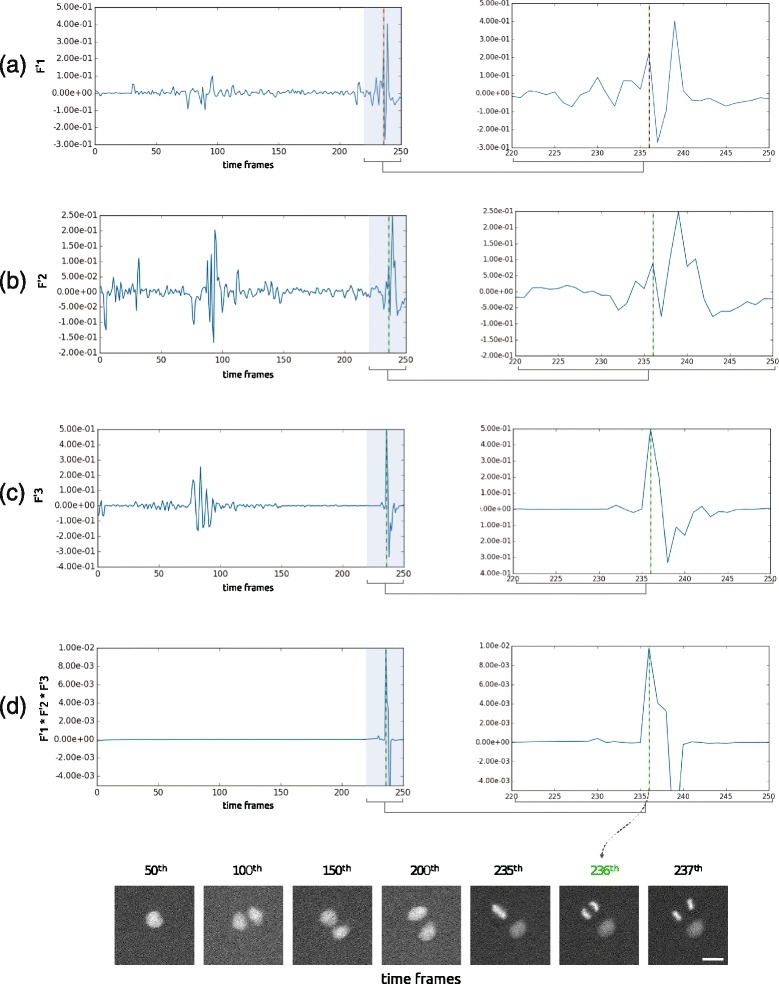
Fig. 7.

Derivatives of the time features (corresponding to the example given in Fig. 6) (a) F1′, (b) F2′, (c) F3′ and (d) their product over time. The right panels are zooms in the peak region. A first clear peak of the feature derivatives product can be observed at the frame of interest. Scalebar is 20 μ m
