
Fig. 3.
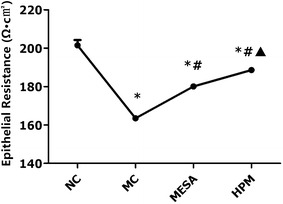
Transepithelial electrical resistance values of each group. NC normal control group, MC model control group, MESA mesalazine group and HPM herb-partitioned moxibustion group. ∗ P < 0.01 versus NC; # P < 0.01 versus MC; ▲ P < 0.01 versus MESA. The standard deviation in MC group (163.53 ± 0.77), MESA group (180.13 ± 1.09) and HPM group (188.60 ± 1.07) is small and not shown in the graph