
Fig. 6.
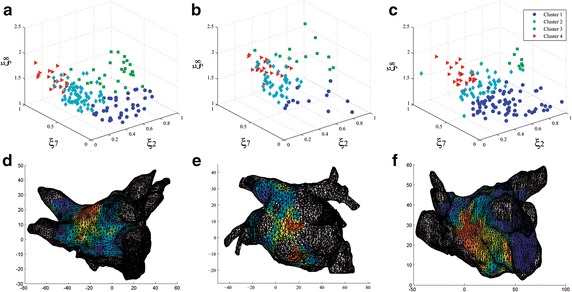
Clustering scatter plots and electroanatomical maps for three patients (DB2): a– c 3D scatter plots for each patient of the most relevant features: , and . Clusters are represented by colors and resembles the structure in all three examined patients. d– f: View of the posterior wall of the left atrium. The clustering results are used to display an electro-anatomical maps for each patient. The maps show the distribution of reconstructed EGM patterns over the atrium. Critical sites with hith level of fractionation are color coded in red