
Figure 3.
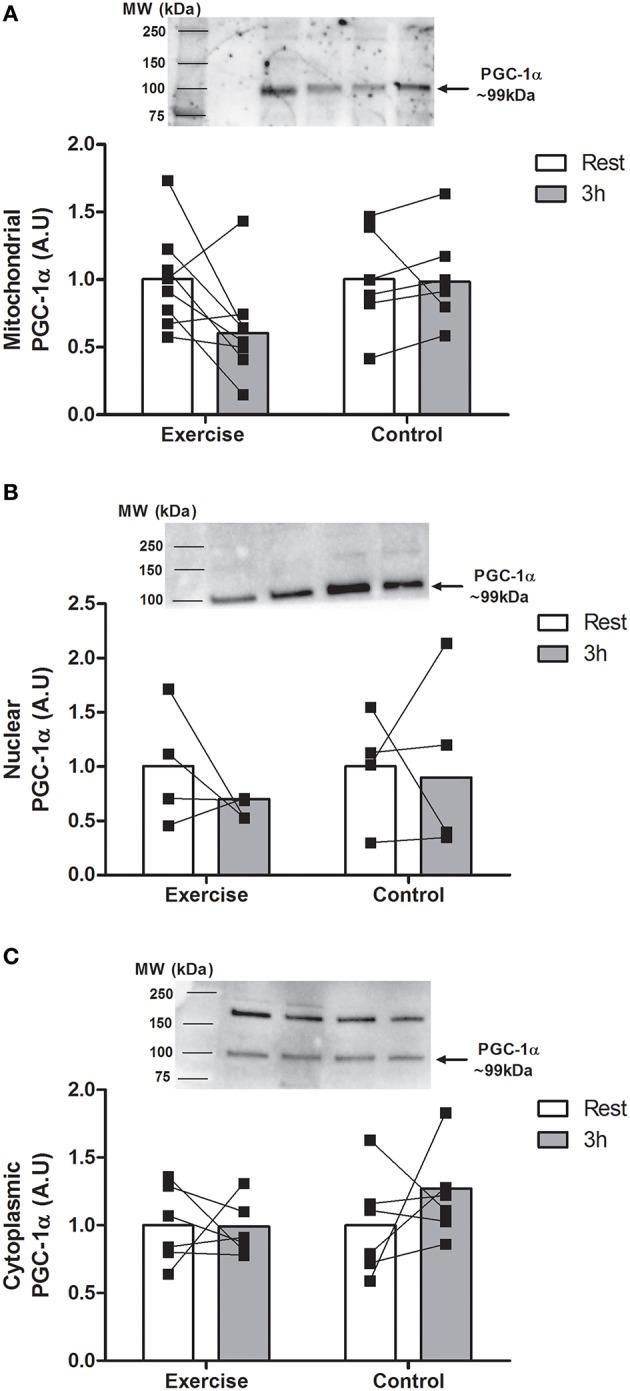
Expression of PGC-1α in the mitochondria (A; n = 8 EX; n = 6 CON), nucleus (B; n = 4 EX, n = 4 CON), and cytoplasm (C; n = 6 EX; n = 6 CON) at rest and 3 h following endurance exercise (60 min cycling ~70% VO2peak) or 4 h rest (CON). All values are expressed relative to stain free gel and presented in arbitrary (means ± SD, n = 8) with statistical significance established when P < 0.05.